In football, teams often benefit from having a dual-threat quarterback on the roster — those with the ability to deliver a touchdown from the pocket or while escaping pressure on the run.
We think your investment strategy should have a product that's also cool under pressure with the potential to deliver in different market environments. Whether it's the ability to perform during bull runs or mitigate bear market downside, we're excited to share with you our dual-threat product.
Let us introduce the Rational/RGN Hedged Equity Fund (RNEIX).
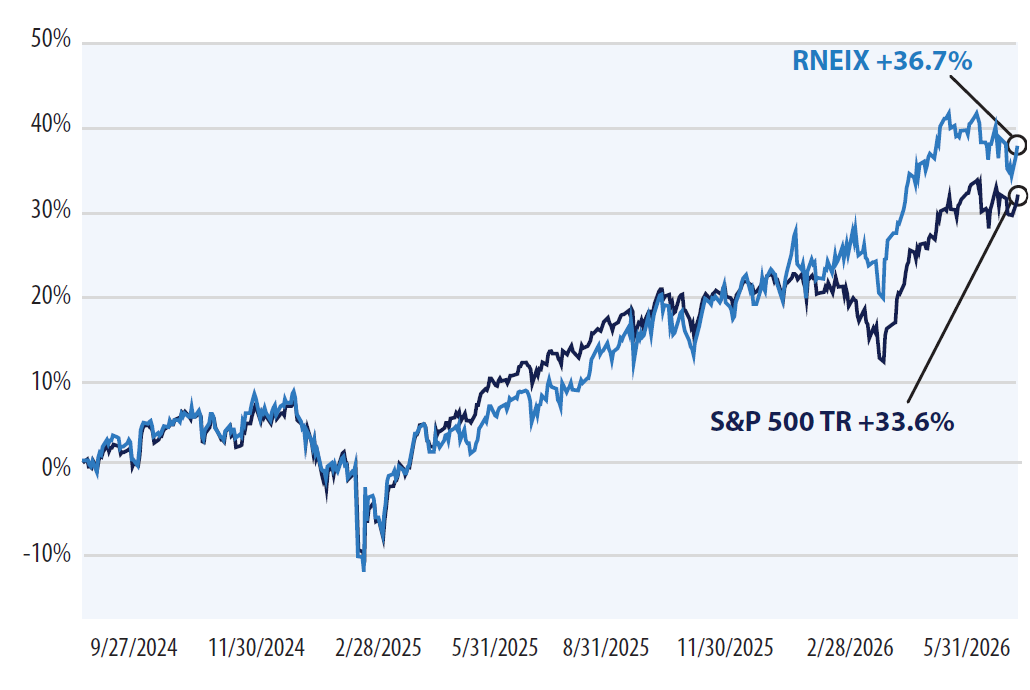
Source: YCharts, Inc. and Rational Advisors, Inc. Data from fund inception on 9/27/2024 to 06/30/2026. Y-axis represents total return. *Equities represented by the S&P 500 Total Return Index. Standard Deviation represents a statistical measurement of the dispersion of a dataset relative to its means. Past performance does not guarantee future results. Please see the end of this presentation for important disclosures.
Since its inception, RNEIX has outperformed the equity market (represented by the S&P 500 Total Return Index) with less volatility due to its “dual-threat” investment strategy. The Fund combines 100% exposure to the S&P 500 with a futures overlay that is designed to reduce bear market downside and provide non-correlated returns in a variety of market environments.
Many hedged equity strategies sacrifice upside potential in an effort to manage downside risk, but this approach often leaves investors feeling disappointed as they may miss out on gains in exchange for limited downside risk mitigation.
RNEIX offers a potential solution to this problem, as it allows for complete exposure to the S&P 500 alongside a futures overlay that seeks to mitigate downside risk. This means investors have the potential to participate in the upside of bull markets while also limiting downside risks during periods of equity stress.
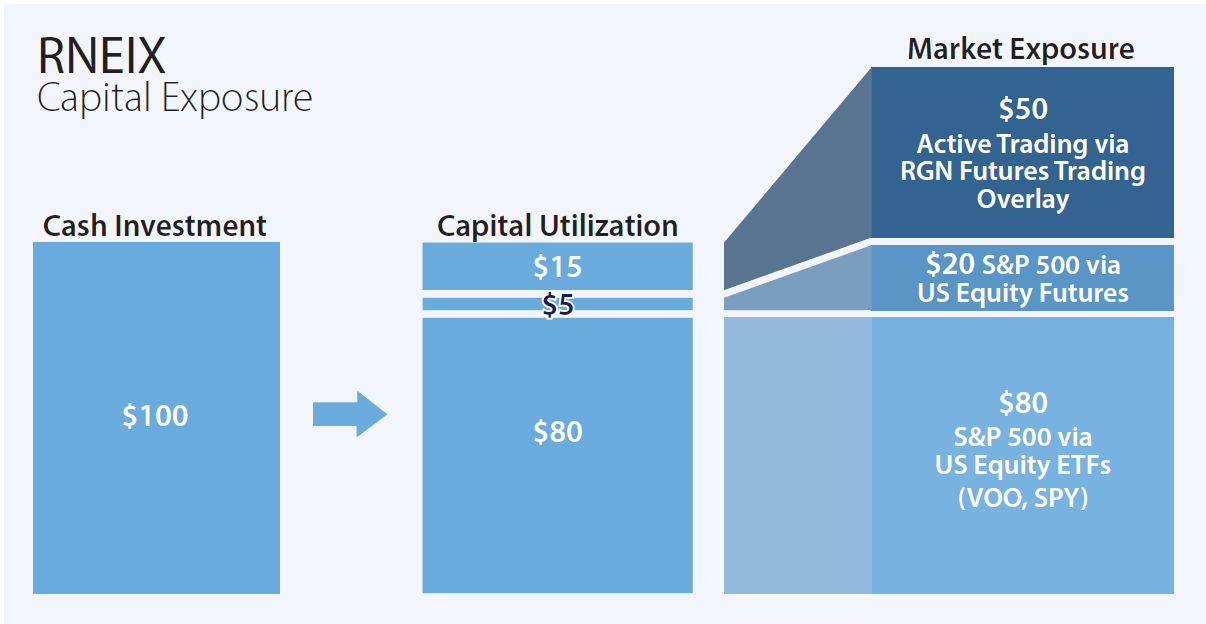
For illustrative purposes only. Capital utilization refers to the dollar amount of margin collateral that an investment uses to buy on the margin. Market Exposure refers to the dollar amount that can be invested in the particular security given the margin posted. For instance, in the chart above, by posting $15 in collateral, the Fund can gain exposure to $50 of the Fund's Futures Trading Overlay. The chart above is showing the dollar amount of exposure investors can achieve to each component.
*Utilized by using derivatives of currencies, fixed income, commodities, equities, and digital assets. There is no guarantee that any investment strategy will achieve its objectives, generate profits or avoid losses.
So how has RNEIX performed when the lights are the brightest? In February and March of 2026, the S&P 500 fell -5.7% as the Iran War and other events shocked markets. During this same period, RNEIX gained +0.4%. This represents the Fund's potential to provide differentiated returns during periods of market volatility.
Similarly, as markets rebounded in April and May of 2026, RNEIX generally kept pace with the S&P 500 and has remained ahead of the index YTD (as of 06/30/2026).
This type of performance isn't isolated to a single period. Since its inception, RNEIX has compiled an impressive set of risk-adjusted metrics.
Source: Rational Advisors, Inc. and Bloomberg L.P. Data from Fund Inception on 9/27/2024 to 6/30/2026. *Annualized return since inception. Past performance does not guarantee future results. Please see the end of this presentation for important disclosures.
140 East 45th Street, 19th Floor
New York, NY 10017
646-827-2761 | Info@RationalMutualFunds.com
| Share Class/Benchmark | QTD | YTD | 1 Year | 3 Years | Since Inception (09/27/2024) |
|---|---|---|---|---|---|
| Class I | 10.76 | 15.64 | 30.44 | n/a | 19.50 |
| S&P 500 Total Return Index | 15.20 | 10.21 | 22.32 | n/a | 17.94 |
| Class A | 10.73 | 15.34 | 29.89 | n/a | 19.10 |
| Class C | 10.57 | 15.11 | 29.13 | n/a | 18.32 |
| Class A w/Load | 5.47 | 9.82 | 23.70 | n/a | 15.84 |
Maximum sales charge for Class A is 5.75%. Maximum Deferred Sales Charge of 1.00% on Class C Shares applies to shares sold within 12 months of purchase. The performance data quoted here represents past performance. Current performance may be lower or higher than the performance data quoted above. Investment return and principal value will fluctuate so that shares, when redeemed, may be worth more or less than their original cost. Past performance is no guarantee of future results. Results shown reflect the waiver, without which the results could have been lower. A fund's performance, especially for very short periods of time, should not be the sole factor in making your investment decisions. To obtain the most recent month end performance information or the Fund's prospectus, please call 800-253-0412 or visit www.rationalmf.com.
The Fund's total operating expenses are 3.57%, 4.91%, and 3.88% for the Class A, C, and I shares, respectively; the Fund's net operating expenses are 2.30%, 3.05%, and 2.05% for the Class A, C and I shares, respectively. Rational Advisors, Inc. has contractually agreed to waive all or a portion of its management fee and/or reimburse certain operating expenses of the Fund to the extent necessary in order to limit the Total Annual Fund Operating Expenses (but excluding (i) acquired fund fees and expenses, (ii) brokerage commissions and trading costs, (iii) interest (including borrowing costs and overdraft charges), (iv) taxes, (v) short sale dividends and interest expenses, and (vi) non-routine or extraordinary expenses (such as regulatory inquiry and litigation or reorganizational costs) to not more than 1.99%, 2.24% and 2.99% of the daily net assets of the Fund's Institutional, Class A, and Class C shares, respectively, through April 30, 2027.
Past performance is no guarantee of future results.
Investors should carefully consider the investment objectives, risks, charges and expenses of the Rational Funds. This and other important information about the Fund is contained in the prospectus, which can be obtained by calling (800) 253-0412 or at www.rationalmf.com. The prospectus should be read carefully before investing. The Rational Funds are distributed by Northern Lights Distributors, LLC member FINRA/SIPC. Neither Rational Advisors, Inc. nor R.G. Niederhoffer Capital Management, Inc. is affiliated with Northern Lights Distributors, LLC.
Important Risk Considerations:
Investing in the Fund carries certain risks. The value of the Fund may decrease in response to the activities and financial prospects of an individual security or group of securities in the Fund's portfolio. Investors in the Fund bear the risk that the Fund may not be successful in implementing its investment strategies. The Fund will invest a percentage of its assets in derivatives, such as swaps, futures, forwards, and options contracts, and hedging strategies. The use of such derivatives and the resulting high portfolio turn-over may expose the Fund to additional risks that it would not be subject to if it invested directly in the securities and commodities underlying those derivatives. The Fund may experience losses that exceed those experienced by funds that do not use swaps, futures, forwards, and options contracts, and hedging strategies. The Fund may be indirectly exposed to risks of investing in digital assets through its investments in digital asset futures contracts; in addition to the risks of futures contracts generally, the markets for digital asset futures contracts have additional unique risks, including that the markets for digital asset futures contracts may be less developed, less liquid, and more volatile than more established futures markets. Investing in commodities markets may subject the Fund to greater volatility than investments in traditional securities. Currency trading risks include market risk, credit risk and country risk. Foreign investing involves risks not typically associated with U.S. investments. Changes in interest rates and the liquidity of certain investments could affect the Fund's overall performance. Other risks include U.S. Government securities risks and investments in fixed income securities. Typically, a rise in interest rates causes a decline in the value of fixed income securities or derivatives owned by the Fund. Furthermore, the use of leveraging can magnify the potential for gain or loss and amplify the effects of market volatility on the Fund's share price. The Fund is subject to regulatory change and tax risks, and changes to current rules could increase costs associated with an investment in the Fund. These factors may affect the value of your investment.
Glossary
Standard Deviation: a measure of the dispersion of monthly returns from its mean return, also known as historical volatility. Futures Overlay (hedging overlay): a strategy used in investment management where futures contracts are employed to enhance portfolio performance or manage risk. Long Position: involves buying an asset with the expectation that its value will increase over time. Mean Reversion: a financial theory suggesting that asset prices will eventually return to their historical average, guiding traders and investors in making decisions based on significant deviations from this mean. Momentum Trading: the practice of trying to make money by trading stocks along with a trend. Foreign Exchange (FX): the global market where currencies are bought and sold. Derivatives: financial contracts between two or more people or organizations that derive value from an underlying security, group of securities, or a benchmark. Tracking Error: a measure of the volatility of excess returns relative to a benchmark. Alpha: a measure of the difference between a fund's actual returns and its expected performance, given its level of risk as measured by beta. Beta: a measure of a fund's sensitivity to market movements. R-Squared: the percentage of a fund's price movements that can be explained by movements in a benchmark index. Sharpe Ratio: compares the return of an investment with its risk. Sortino Ratio: a variation of the Sharpe ratio that differentiates harmful volatility from total overall volatility by using the asset's standard deviation of negative portfolio returns instead of the total standard deviation of portfolio returns. Drawdown: a peak-to-trough decline during a specific period. S&P 500 Total Return Index: considered to be generally representative of the U.S. large capitalization stock market as a whole.
20260916-5923085