
Adjusting to a New World: This is Not Your Grandfather’s Fixed Income Market
Interest Rates Remain Below the Long Run Average and Aren’t, In Our View, Positioned to Experience a Multi-Decade Drop to Fuel an Easy Bond Bull Market

Are You Happy with Your Fixed Income Returns Over the Past Five Years?
Do you think the next five years in fixed income are going to be drastically different? We believe it’s likely to be more of the same and want to give you a reason to get excited about bonds again.
Here’s How the Rational Special Situations Income Fund (RFXIX) Performed:
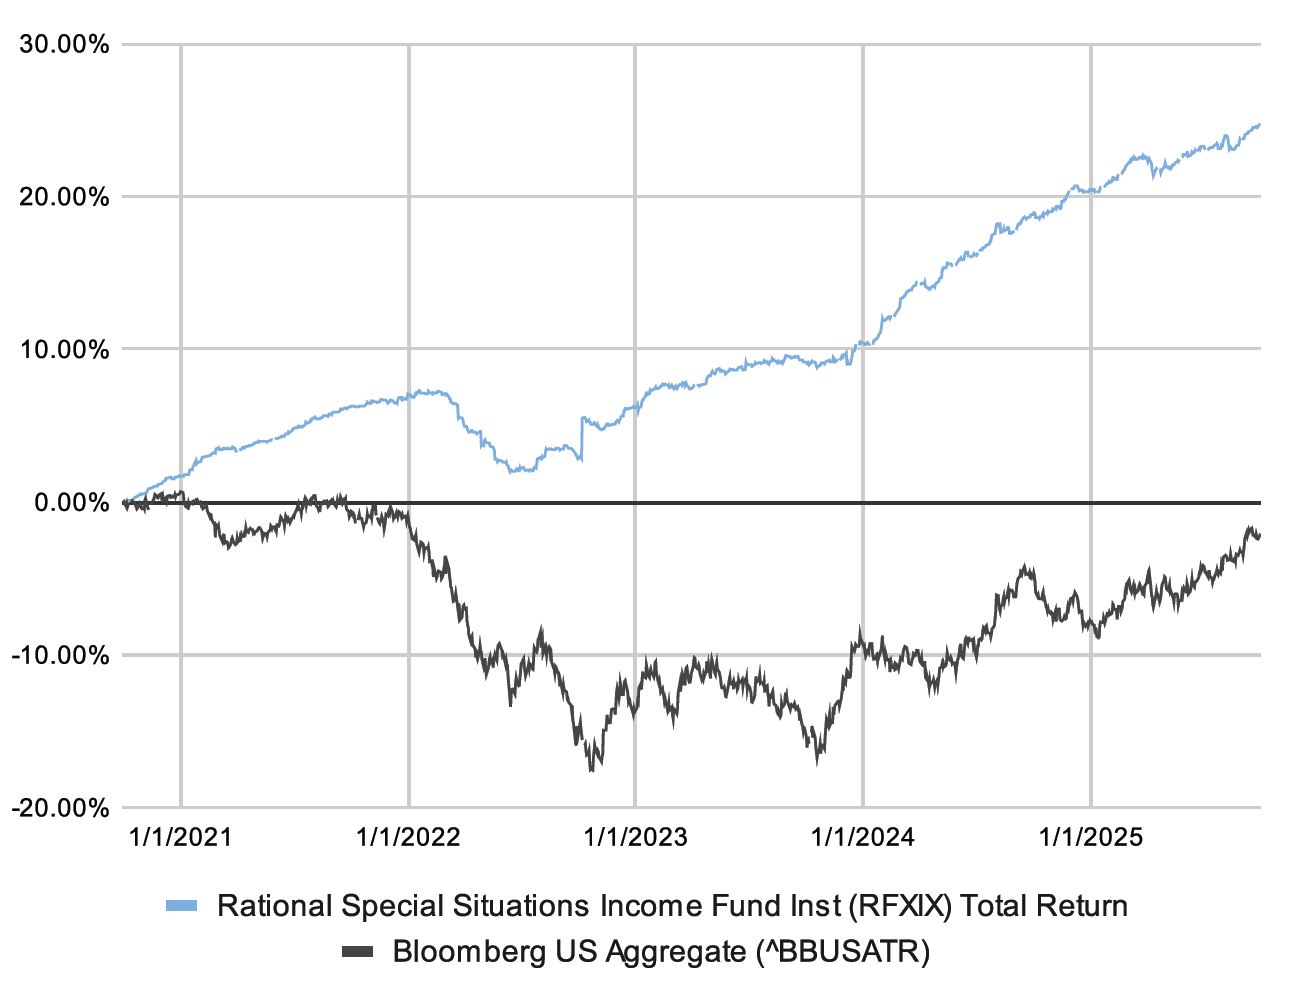
During the Past 3 Years, RFXIX has Provided Less Volatile Returns
With a lower standard deviation than the Bloomberg US Aggregate TR (the “Agg”) and a 60/40 portfolio split of the S&P 500 and the Agg, investors have experienced less volatility with RFXIX.
How RFXIX Differentiates from the Market:
 There are two major risks in fixed income investing: credit risk and interest rate risk. Over the past five years, RFXIX has shown the ability to outperform the Agg in the face of both.
- The Fund strives to mitigate interest rate risk by investing the majority of its assets in Floating Rate Securities.
- RFXIX seeks to reduce credit risk by investing predominantly in Non-Agency RMBS (“Legacy Mortgages Backed Securities) that were issued prior to the Global Financial Crisis of 2008.
Ready to get excited about fixed income again? Let’s talk about the Rational Special Situations Income Fund (RFXIX).
Data as of Quarter End: [table “206” does not have that cell /]
Annualized if greater than a year
| Share Class | 1 Month | 3 Months | 6 Months | YTD | 1 Year | 3 Years Annualized | 5 Years Annualized | 10 Years Annualized | Since Inception Annualized |
| Class A | [table “206” does not have that cell /] |
[table “206” does not have that cell /] |
[table “206” does not have that cell /] |
[table “206” does not have that cell /] |
[table “206” does not have that cell /] |
[table “206” does not have that cell /] |
[table “206” does not have that cell /] |
[table “206” does not have that cell /] |
[table “206” does not have that cell /] |
| Class C | [table “207” does not have that cell /] |
[table “207” does not have that cell /] |
[table “207” does not have that cell /] |
[table “207” does not have that cell /] |
[table “207” does not have that cell /] |
[table “207” does not have that cell /] |
[table “207” does not have that cell /] |
[table “207” does not have that cell /] |
[table “207” does not have that cell /] |
| Class I | [table “208” does not have that cell /] |
[table “208” does not have that cell /] |
[table “208” does not have that cell /] |
[table “208” does not have that cell /] |
[table “208” does not have that cell /] |
[table “208” does not have that cell /] |
[table “208” does not have that cell /] |
[table “208” does not have that cell /] |
[table “208” does not have that cell /] |
| Class A w/Sales Load | [table “206” does not have that cell /] |
[table “206” does not have that cell /] |
[table “206” does not have that cell /] |
[table “206” does not have that cell /] |
[table “206” does not have that cell /] |
[table “206” does not have that cell /] |
[table “206” does not have that cell /] |
[table “206” does not have that cell /] |
[table “206” does not have that cell /] |
The performance data quoted here represents past performance. Current performance may be lower or higher than the performance data quoted above. Investment return and principal value will fluctuate, so that shares, when redeemed, may be worth more or less than their original cost. Past performance is no guarantee of future results. To obtain the most recent month end performance information or the Fund’s prospectus please call 800-253-0412 or visit www.RationalMF.com.
The Fund’s maximum sales charge for Class “A” shares is 4.75%. Gross expense ratios for the fiscal year were 2.07%, 2.76%, and 1.81% for Class A, C, and I share, respectively. Maximum Deferred Sales Charge of 1.00% on Class C Shares applies to shares sold within 12 months of purchase. Results shown reflect the waiver, without which the results could have been lower. A fund’s performance, especially for very short periods of time, should not be the sole factor in making your investment decisions.
Past performance is not a guarantee of future results. There is no assurance that the Fund will achieve its investment objectives. You cannot invest directly in an index and unmanaged index returns do not reflect fees, expenses, or sales charges.
Investors should carefully consider the investment objectives, risks, charges and expenses of the Rational Funds. This and other important information about the Fund is contained in the prospectus, which can be obtained by calling (800) 253-0412 or at www.RationalMF.com. The prospectus should be read carefully before investing. The Rational Funds are distributed by Northern Lights Distributors, LLC member FINRA/SIPC. Rational Advisors, Inc. is not affiliated with Northern Lights Distributors, LLC.
Important Risk Considerations
Investing in the Fund carries certain risks. The value of the Fund may decrease in response to the activities and financial prospects of an individual security or group of securities in the Fund’s portfolio. Investors in the Fund bear the risk that the Fund may not be successful in implementing its investment strategies. The Fund is subject to concentration risk. When the Fund invests in asset-backed securities and mortgage-backed securities, the Fund is subject to the risk that, if the underlying borrowers fail to pay interest or repay principal, the assets backing these securities may not be sufficient to support payments on the securities. Interest rate risk is the risk that bond prices overall, including the prices of securities held by the Fund, will decline over short or even long periods of time due to rising interest rates. Bonds with longer maturities tend to be more sensitive to interest rates than bonds with shorter maturities. Lower-quality bonds, known as “high yield” or “junk” bonds, present greater risk than bonds of higher quality, including an increased risk of default. Credit risk is the risk that the issuer of a security will not be able to make principal and interest payments when due. These factors may affect the value of your investment.
The Fund commenced operations by acquiring all of the assets and liabilities of ESM Fund I, L.P. (the “Predecessor Fund”) in a tax-free reorganization on July 17, 2019 (the “Reorganization”). In connection with the Reorganization, investors in the Predecessor Fund received Institutional Shares of the Fund. The Fund’s investment objectives, policies, guidelines and restrictions are, in all material respects, equivalent to those of the Predecessor Fund. However, the Predecessor Fund was not registered under the 1940 Act and, therefore, was not subject to certain investment restrictions, limitations and diversification requirements that are imposed by the 1940 Act or Subchapter M of the Internal Revenue Code, which, if they had been applicable, might have adversely affected the Predecessor Fund’s performance. The Fund’s Sub-Advisor was the investment adviser to the Predecessor Fund. The Fund’s fees and expenses are expected to be higher than those of the Predecessor Fund, so if the Fund’s expenses were applied to the Predecessor Fund’s performance, the performance would have been lower.
Glossary:
Bond Bull Market – a bond market in which prices are rising or are expected to rise over an extended period of time. Effective Federal Funds Rate – the volume-weighted median of the interest rates banks charge each other for overnight lending in the federal funds market, and it‘s a key indicator of the cost of short-term borrowing in the US. US 10-Year Government Bond Interest Rate – represents the interest rate the U.S. government pays to borrow money for a 10-year period. It‘s a widely watched benchmark that reflects investor sentiment about the economy and the government‘s financial health. Volatility – a statistical measure of the dispersion of returns for a given security or market index. Floating Rate Securities – fixed-income instruments where the interest rate (coupon) adjusts periodically, typically based on a benchmark rate or the Fed Funds rate. This contrasts with fixed-rate securities, which have a set interest rate for the entire duration of the bond. Non-Agency RMBS (Legacy Mortgage Backed Securities) – debt-based assets backed by the interest paid on residential loans. These assets are constructed by a non-government agency investment-banking firm. Standard Deviation – a statistical measurement of the dispersion of a dataset relative to its mean. 60/40 Portfolio – an investment strategy that allocates 60% of assets to stocks, (S&P 500 TR Index) and 40% to bonds (the Agg). Bloomberg US Agg TR Index – a market capitalization-weighted index that is designed to measure the performance of the U.S. investment grade bond market with maturities of more than one year. Bloomberg MBS TR Index – a benchmark that tracks agency mortgage pass-through securities. S&P 500 Total Return Index – measures the performance of the S&P 500 index by including both price changes and the reinvestment of dividends
20250411-4395341