
Deciphering Alpha from Beta in Fixed Income
How Strategies Like the Rational Special Situations Income Fund (RFXIX) Can Help Investors Find Alpha in the New Market Environment
By Michael Schoonover | July 2024
During the 40-year bond bull market, it was often enough to “be the market” for successful fixed income investing, but today we’ll explain why in the current environment, it’s important for investors to be doing more.
In the past, investors looking for more could easily identify outperforming products in terms of return and/ or yield, as there was little stress in the market to reveal weakness in the portfolios, especially during the period of unprecedented monetary policy between 2009 and 2021.
In many cases, though, the outperformance was not due to manager skill (alpha) but rather leveraged exposure to systematic market risks (beta). Some disruptions in the fixed income markets in 2018 and 2020 revealed the real risks present. Conditions ultimately began to deteriorate in 2022 as the bond bull market came to an end with the worst year on record for the asset class, based on the history of the Bloomberg Aggregate Bond Index going back to the 1970’s. Investors with exposure to alpha had the potential to hold up well, but “being the market” meant being down double-digits, and leveraged beta exposure, in many cases, resulted in a portfolio meltdown.
Going forward, it is unlikely that “being the market” will be enough for fixed income investors. Identifying managers that can outperform by generating alpha will be key. In this article, we cover the factors that investors should review to determine if their fixed income manager is generating alpha. We provide the Rational Special Situations Income Fund (RFXIX) as an example of a fixed income product that has a long history of outperformance through alpha generation. RFXIX primarily invests in seasoned mortgage- backed securities backed by mortgages with decades of payments and high homeowner equity. Many bonds are floating rate and therefore carry little interest rate risk. Yet, between 2/1/2009 and 6/30/2024, RFXIX generated a +493% cumulative return compared to just +49% for the Bloomberg Aggregate Bond Index and +36% for the Bloomberg MBS Total Return Index.
RFXIX has outperformed the traditional fixed income benchmarks since 2009.
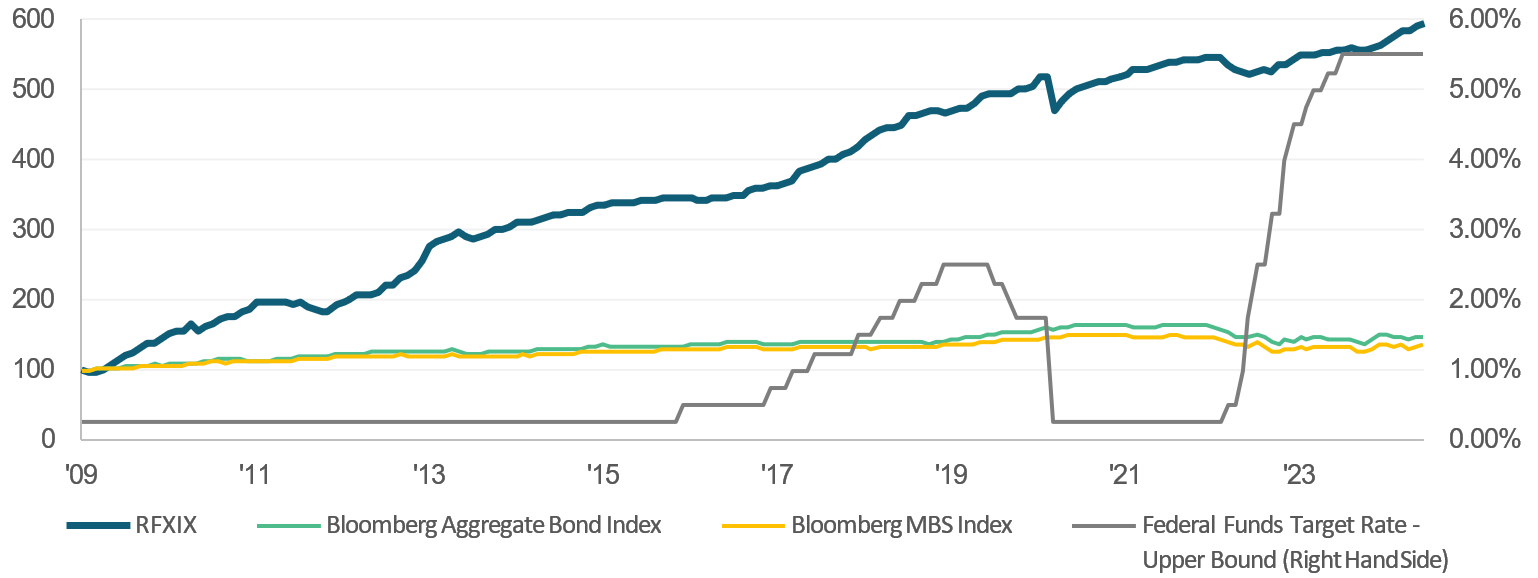
Rational Advisors, Inc. and Bloomberg LP. Based on monthly return data from 2/1/2009 to 6/30/2024. The performance data quoted here represents past performance. Current performance may be lower or higher than the performance data quoted above. Investment return and principal value will fluctuate, so that shares, when redeemed, may be worth more or less than their original cost. Past performance is no guarantee of future results. To obtain the most recent month end performance information please call 800-253-0412 or visit www.RationalMF.com.
Past performance is not indicative of future results.
In an environment with limited options, senior mortgage bond strategies
like RFXIX offer a compelling option for meaningful yield and outperformance.
like RFXIX offer a compelling option for meaningful yield and outperformance.
Here are three reasons why investors have been reallocating from their traditional fixed income exposure to RFXIX.
STEP 1.
SEEK OUT KEY WARNING SIGNS OF LEVERAGED BETA.
In fixed income, it’s often difficult for investors to distinguish between alpha and beta because fixed income managers have many beta levers to pull. Most investors associate fixed income beta with a fund’s duration (or interest rate exposure), as many funds have sought to take advantage of years of favorable Federal Reserve policy. However, a manager can also move to different segments of the fixed income market, move down the credit spectrum, trade in less liquid instruments, etc., making it easier to deviate from a benchmark but do so in a manner where returns are still derived from not-so-obvious beta factors. However, investors can better position themselves by looking for key warning signs of beta disguised as alpha.
The risk of leveraged beta is usually easier to visualize in equities. Think about innovation-themed products where between 2020 and 2021 investors poured billions of dollars into some outperforming funds under the guise of alpha and a genius manager, only to realize that they simply invested into very high beta products that crashed horribly in 2022. In hindsight, a sign that something was wrong could be observed by the fact that there were a lot of funds performing similarly well, they just didn’t get the same attention. A lot of funds outperforming the benchmark in the same manner can be an indication of beta and not alpha.
Applying this same logic to fixed income, investors can research to see if many similar fixed income funds have the same level of outperformance. Just as was the case with the innovation equity products in 2020- 2021, a similar degree of significant outperformance by several funds could be an indicator that beta is at play. On the other hand, if only a few funds are performing very well in the space, that could be an indicator of alpha.
Investors should also examine the returns of a fund over key periods to see if they correlate with beta factors. Did the fund have unusual weakness during periods where lower credit quality products tumbled or when interest rates dropped? If so, it’s probably worth a deeper dive to understand if the manager is going down the credit spectrum or making interest rate bets to boost returns.
Using RFXIX as an example, the fund generated positive median monthly returns during all interest rate environments, indicating that leveraged-beta interest rate bets are not likely a contributor to the outperformance as there would have likely been strong returns in some environments but losses in others.
RFXIX HAS GENERATED POSITIVE MEDIAN RETURNS IN VARIOUS INTEREST RATE ENVIRONMENTS.
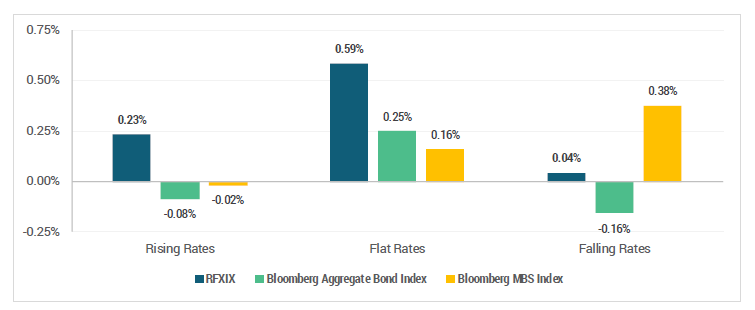
Rational Advisors, Inc. and Bloomberg LP. Based on monthly returns (except for February 2022) from 2/1/2009 to 6/30/2024. Interest rate environment determined by Federal Funds Target Rate Upper Bound change during calendar month. Rising rates: 25 bps or more increase during month; Flat rates: no change; Falling rates: 25 bps or more decrease during month. Median return used to reduce the impact of outlier months, including March 2020.
Past performance is not indicative of future results.
STEP 2.
MAKE SURE THE SOURCE OF ALPHA MAKES SENSE.
If the screening indicates that the product is a potential candidate for alpha-based outperformance, then the next step is to understand the manager’s claim for the source of outperformance. RFXIX provides a compelling example of an alpha-based approach in that the portfolio managers seek out special situations investments that offer asymmetric upside return potential, meaning that a successful investment could lead to excess positive returns while an unsuccessful investment would be expected to exhibit the typical asset class returns. The following examples illustrate how this alpha-driven approach has worked historically.
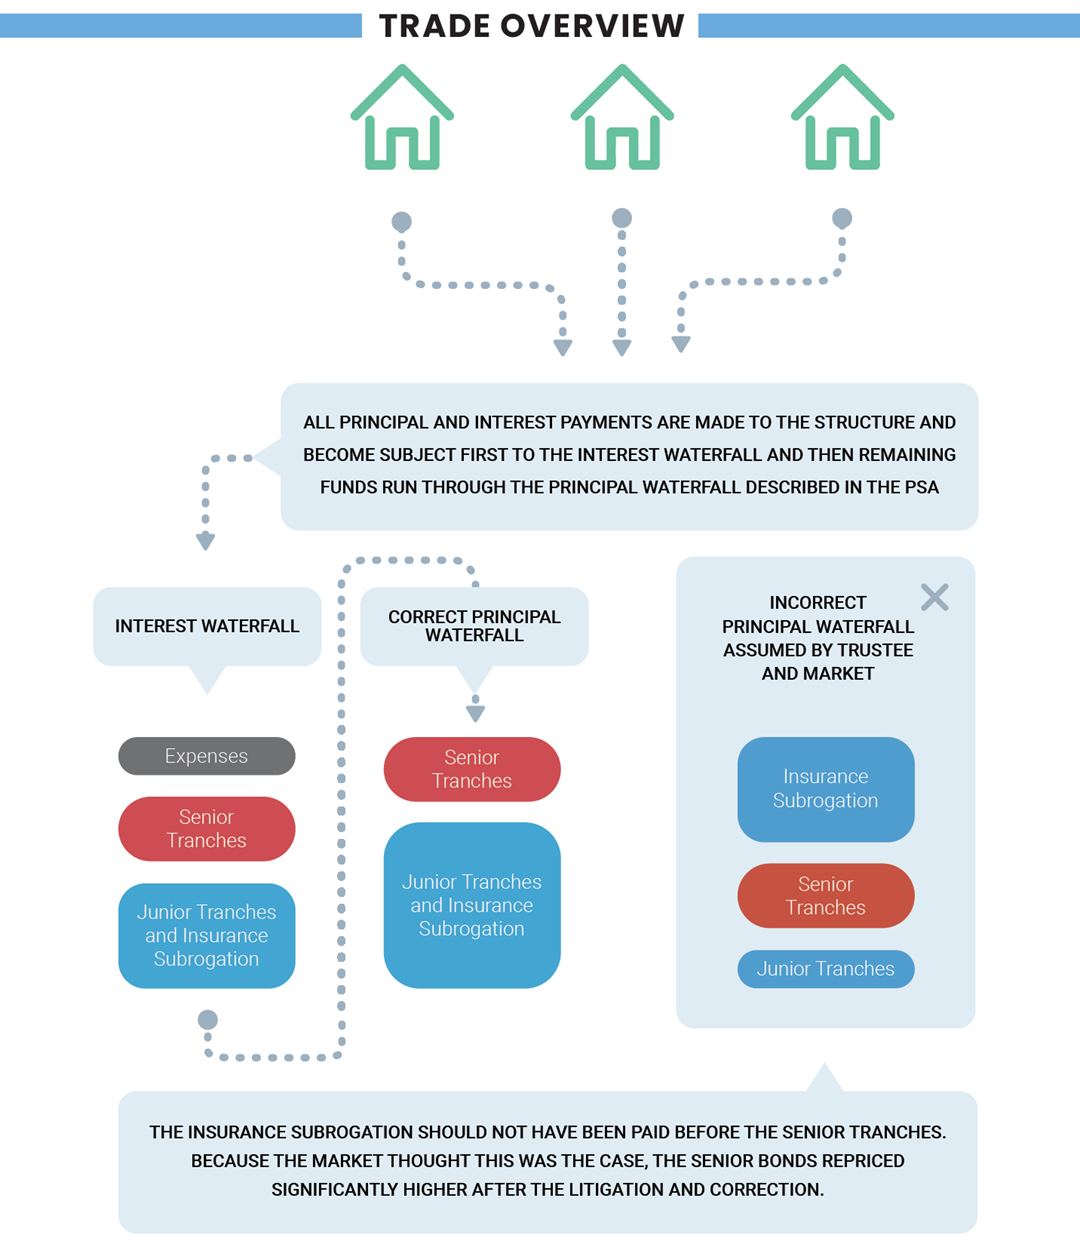
Example 1: Residential Mortgage-Backed Securities (RMBS) Litigation
One example of this is when portfolio managers identified a bond where the servicer was not correctly interpreting the payout. In this case, the servicer was paying the principal on the bonds to an insurance company before the senior bondholders. It was paying the insurance company for losses the insurance company had previously paid out on mezzanine bonds. Insurance recovery rights are called rights of subrogation. RFXIX bought the senior bonds and challenged the servicer.
After successfully litigating, the servicer corrected the cash waterfall to pay the senior bondholders prior to the insurance subrogation. During the litigation, the servicer had not made any payouts to either party but held the payments in escrow until the court determined who and how they should pay out. Once the market realized the new cashflow structure, the price of the senior bonds increased substantially. The actual outcome was +158% on the trade, after the price appreciation of the bonds and the legal expenses. Had the portfolio managers been wrong, it was likely that no incremental losses would have been incurred because the litigation was never priced into the bonds by the market.
Tranches are segments created from a pool of securities—usually debt instruments such as bonds or mortgages—that are divvied up by risk, time to maturity, or other characteristics in order to be marketable to different investors.
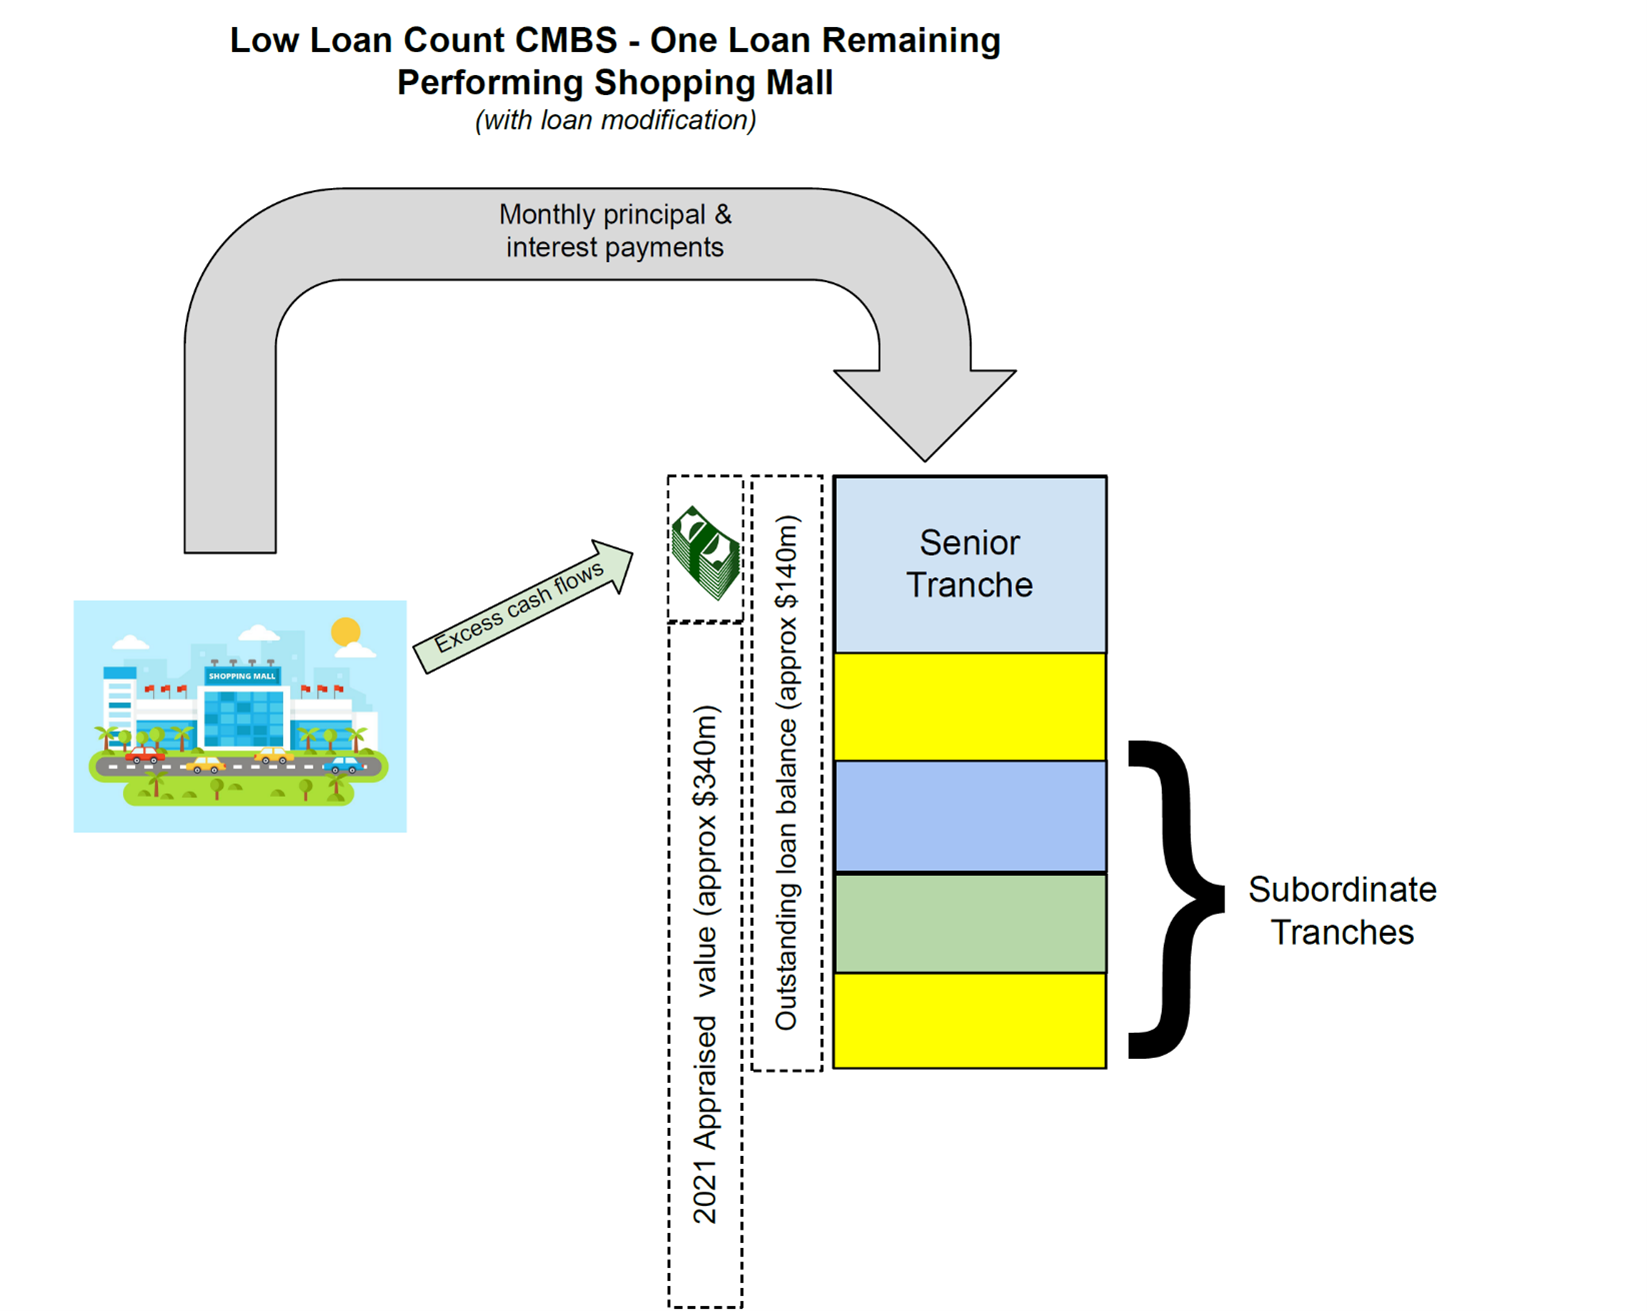
Example 2: Market Misunderstanding of Commercial Mortgage-Backed Securities (CMBS)
The portfolio managers identified a CMBS bond being viewed negatively by the bond market because it was backed by one remaining loan with a modification and with a shopping mall as collateral. However, the investment team, through their unique combination of financial, legal, and technical expertise, uncovered several factors that made this bond attractive. First, the mall had more than a 98% occupancy rate. Second, the loan was modified to include a provision that excess cash flows should be held in escrow to the benefit of bondholders, and the mall was producing excess cash flows of $1.2 million/month.
RFXIX took a position in this bond with more than a 10% yield-to-maturity. The loan is performing monthly and there is very limited credit risk as the bonds are covered by 80% of the balance of the escrow cash account (which grows each month) and the remainder by less than 2% of the appraised value of the mall.
There is no guarantee that any investment strategy will achieve its objectives, generate profits or avoid losses.
Integrating RFXIX Into A Portfolio
It is our belief that RFXIX is well positioned to provide meaningful yield and outperformance relative to traditional fixed income during various environments. For this reason, we see this Fund as a strong fit as a core fixed income allocation in an investor’s portfolio. The uncorrelated nature of the Fund and its consistent strong returns can also make it versatile enough to replace other underperforming investments in this tough market environment.
Shift Allocations to Senior Floating Rate Mortgage
Bonds for Rising Rate Environments.
Bonds for Rising Rate Environments.
RFXIX has a history of outperformance during adverse fixed income periods in part by utilizing its focus on floating rate bonds backed by mortgages that typically have 50% or higher homeowner equity.
About the Author

Michael Schoonover is Chief Operating Officer of Catalyst Capital Advisors LLC and Rational Advisors, Inc. He began his association with Catalyst in 2011 as a research consultant supporting the implementation and back testing of quantitative strategies. In March 2013, he became a senior analyst at Catalyst to provide investment research for several mutual funds. From 2005-2011, he served in various technical and scientific management roles with the Perrigo Company. Mr. Schoonover has an MBA with high distinction from the University of Michigan Ross School of Business and a BS from the University of Michigan.
Data as of Quarter End: [table “206” does not have that cell /]
Annualized if greater than a year
| Share Class | 1 Month | 3 Months | 6 Months | YTD | 1 Year | 3 Years Annualized | 5 Years Annualized | 10 Years Annualized | Since Inception Annualized |
| Class A | [table “206” does not have that cell /] |
[table “206” does not have that cell /] |
[table “206” does not have that cell /] |
[table “206” does not have that cell /] |
[table “206” does not have that cell /] |
[table “206” does not have that cell /] |
[table “206” does not have that cell /] |
[table “206” does not have that cell /] |
[table “206” does not have that cell /] |
| Class C | [table “207” does not have that cell /] |
[table “207” does not have that cell /] |
[table “207” does not have that cell /] |
[table “207” does not have that cell /] |
[table “207” does not have that cell /] |
[table “207” does not have that cell /] |
[table “207” does not have that cell /] |
[table “207” does not have that cell /] |
[table “207” does not have that cell /] |
| Class I | [table “208” does not have that cell /] |
[table “208” does not have that cell /] |
[table “208” does not have that cell /] |
[table “208” does not have that cell /] |
[table “208” does not have that cell /] |
[table “208” does not have that cell /] |
[table “208” does not have that cell /] |
[table “208” does not have that cell /] |
[table “208” does not have that cell /] |
| Class A w/Sales Load | [table “206” does not have that cell /] |
[table “206” does not have that cell /] |
[table “206” does not have that cell /] |
[table “206” does not have that cell /] |
[table “206” does not have that cell /] |
[table “206” does not have that cell /] |
[table “206” does not have that cell /] |
[table “206” does not have that cell /] |
[table “206” does not have that cell /] |
*Inception: 02/01/2009. The performance shown prior to July 17, 2019 is that of the Predecessor Fund, which reflects all of the
Predecessor Fund’s actual fees and expenses adjusted to include any fees of each share class.
Maximum sales charge for Class A is 4.75%. Maximum Deferred Sales Charge of 1.00% on Class C Shares applies to shares sold within 12 months of purchase. The performance data quoted here represents past performance. Current performance may be lower or higher than the performance data quoted above. Investment return and principal value will fluctuate, so that shares, when redeemed, may be worth more or less than their original cost. Past performance is no guarantee of future results. Results shown reflect the waiver, without which the results could have been lower. A fund’s performance, especially for very short periods of time, should not be the sole factor in making your investment decisions. To obtain the most recent month end performance information or the Fund’s prospectus please call 800-253-0412 or visit www.rationalmf.com.
There is no assurance that the Fund will achieve its investment objective. You cannot invest directly in an index and unmanaged index returns do not reflect any fees, expenses or sales charges. Gross expense ratios for share classes A, C, and I are 2.04%, 2.75%, and 1.78%, respectively.
Past performance is not a guarantee of future results.
Investors should carefully consider the investment objectives, risks, charges and expenses of the Rational Funds. This and other important information about the Fund is contained in the prospectus, which can be obtained by calling (800) 253-0412 or at www.rationalmf.com. The prospectus should be read carefully before investing. The Rational Funds are distributed by Northern Lights Distributors, LLC member FINRA/SIPC. Rational Advisors, Inc. is not affiliated with Northern Lights Distributors, LLC.
Risk Considerations:
Investing in the Fund carries certain risks. The value of the Fund may decrease in response to the activities and financial prospects of an individual security in the Fund’s portfolio. Investors in the Fund bear the risk that the Fund may not be successful in implementing its investment strategies. The Fund is non-diversified and may invest a greater percentage of its assets in a particular issue and may own fewer securities than other mutual funds; the Fund is subject to concentration risk. When the Fund invests in asset-backed securities and mortgage-backed securities, the Fund is subject to the risk that, if the underlying borrowers fail to pay interest or repay principal, the assets backing these securities may not be sufficient to support payments on the securities. Interest rate risk is the risk that bond prices overall, including the prices of securities held by the Fund, will decline over short or even long periods of time due to rising interest rates. Bonds with longer maturities tend to be more sensitive to interest rates than bonds with shorter maturities. Lower-quality bonds, known as “high yield” or “junk” bonds, present greater risk than bonds of higher quality, including an increased risk of default. Credit risk is the risk that the issuer of a security will not be able to make principal and interest payments when due. These factors may affect the value of your investment.
The thoughts and opinions expressed in the article are solely those of the author as of February 15, 2023. The discussion of individual holdings should not be considered a recommendation of such holdings by the Fund’s investment adviser. The discussion is designed to provide a reader with an understanding of how the Fund’s investment adviser manages the Fund’s portfolio.
The Fund commenced operations by acquiring all of the assets and liabilities of ESM Fund I, L.P. (the “Predecessor Fund”) in a tax-free reorganization on July 17, 2019 (the “Reorganization”). In connection with the Reorganization, investors in the Predecessor Fund received Institutional Shares of the Fund. The Fund’s investment objectives, policies, guidelines and restrictions are, in all material respects, equivalent to those of the Predecessor Fund. However, the Predecessor Fund was not registered under the 1940 Act and, therefore, was not subject to certain investment restrictions, limitations and diversification requirements that are imposed by the 1940 Act or Subchapter M of the Internal Revenue Code, which, if they had been applicable, might have adversely affected the Predecessor Fund’s performance. The Fund’s Sub-Advisor was the investment adviser to the Predecessor Fund. The Fund’s fees and expenses are expected to be higher than those of the Predecessor Fund, so if the Fund’s expenses were applied to the Predecessor Fund’s performance, the performance would have been lower.
Index Definitions:
The Bloomberg US Agg Index is a broad-based flagship benchmark that measures the investment grade, US dollar-denominated, fixed-rate taxable bond market. The index includes Treasuries, government-related and corporate securities, MBS (agency fixed-rate pass-throughs), ABS and CMBS (agency and non-agency).
The Bloomberg US Mortgage Backed Securities (MBS) Index tracks fixed-rate agency mortgage backed pass-through securities guaranteed by Ginnie Mae (GNMA), Fannie Mae (FNMA), and Freddie Mac (FHLMC). The index is constructed by grouping individual TBA-deliverable MBS pools into aggregates or generics based on program, coupon and vintage.
There is no guarantee that any investment strategy will achieve its objectives, generate profits or avoid losses.
20240726-3744706