
Rational Equity Armor Fund
Tickers: HDCAX | HDCEX | HDCTX
Fund Objective
The Fund’s investment objective is to seek total return on investment, with dividend income an important component of that return.
Fund Highlights
The Fund primarily invests in common stock of dividend paying companies included within the S&P 500 Index. The Fund may also invest up to 20% of its assets in futures contracts on the Cboe Volatility Index (the “VIX Index”) and in cash and cash equivalents as a hedge against the common stock. The managers use a rules-based quantitative strategy to create a portfolio composed of common stock that they believe offers the best return potential and low volatility under the current economic environment.
Investment Strategy
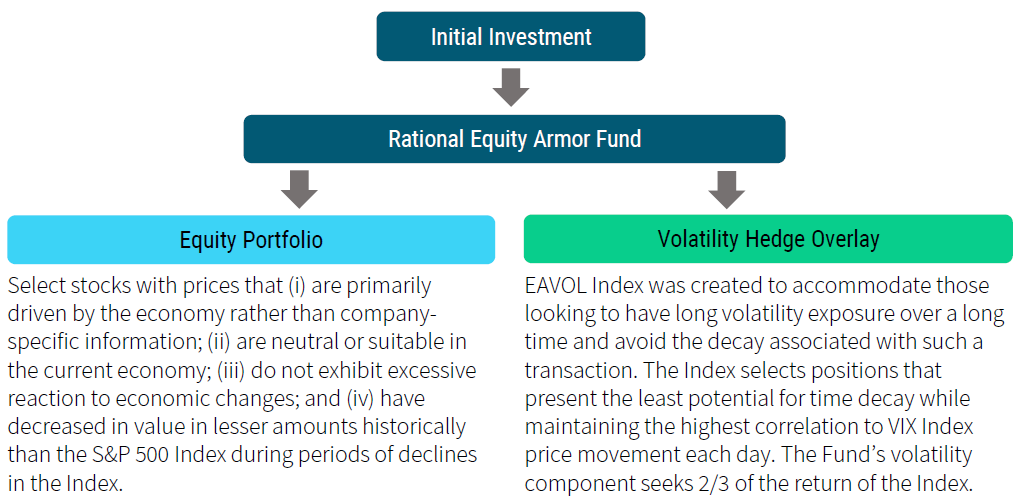
The Fund primarily invests in common stock of dividend paying companies included within the S&P 500 Index. The Fund may also invest up to 20% of its assets in futures contracts on the Cboe Volatility Index (the “VIX Index”) and in cash and cash equivalents as a hedge against the common stock.
The managers use a rules-based quantitative strategy to create a portfolio composed of common stock that they believe offers the best return potential and low volatility under the current economic environment.
Stocks are selected based on a proprietary model comprised of the following factors (i) domestic factors such as unemployment rate, corporate cash flow, housing starts, auto sales, and new durable goods; (ii) monetary factors; (iii) interest rates; (iv) various index levels including gold index, energy prices, consumer price index; and (v) international factors such as euro exchange rates, FTSE 100, Tokyo stock exchange, and agricultural exports.
The Fund will invest in VIX futures utilizing the same methodology as the Equity Armor Investments VOL 365 Index (the “EAVOL Index”) and will seek to achieve approximately two-thirds of the return of the EAVOL Index.
Portfolio Manager Insights
Fund Management

Brian Stutland
- Managing Partner, CIO, and CCO of Equity Armor since 2011
- BS and MS in Engineering, University of Michigan

Luke Rahbari
- Member and Portfolio Manager of Equity Armor since 2011
- BBA from Eastern Michigan University and MBA from University of Chicago

Joseph Tigay
- Chief Trading Officer and Portfolio Manager of Equity Armor since 2011
- BS in Economics, Michigan State University
Fund Overview
Data as of: 2025-07-10T00:00:00
| Ticker | HDCAX | HDCEX | HDCTX | HDCAX |
| Share Class | Class A | Class C | Class I | Class A w/ Sales Load |
| CUSIP | 628255101 | 628255200 | 628255309 | 628255101 |
| Inception Date | 2001-02-28T00:00:00 | 2014-01-03T00:00:00 | 2001-02-28T00:00:00 | 2001-02-28T00:00:00 |
| As of Date | 2025-07-10T00:00:00 | 2025-07-10T00:00:00 | 2024-08-20T00:00:00 | 2025-07-10T00:00:00 |
| Daily NAV | 10.17 | 9.92 | 9.19 | 10.17 |
| NAV Change | 0.05 | 0.05 | -0.01 | 0.05 |
| % NAV Change | 0.49% | 0.51% | -0.11% | 0.49% |
Current Fund Performance
Data as of: 2025-07-10T00:00:00
Prior to December 13, 2019, the Fund implemented a different investment strategy.
| Share Class | 1 Month | 3 Months | 6 Months | YTD | 1 Year | 3 Years Annualized | 5 Years Annualized | 10 Years Annualized | Since Inception Annualized |
| Class A | 3.04% | 10.78% | 7.62% | 6.94% | 10.18% | 8.78% | 6.94% | 4.02% | 5.47% |
| Class C | 3.01% | 10.59% | 7.24% | 6.55% | 9.49% | 8.05% | 6.18% | 3.34% | 3.57% |
| Class I | 2.91% | 5.51% | 8.24% | 12.21% | 18.43% | 2.61% | 8.25% | 3.16% | 5.46% |
| Class A w/Sales Load | -1.83% | 5.50% | 2.52% | 1.90% | 4.95% | 7.01% | 5.91% | 3.52% | 5.25% |
Quarterly Fund Performance
Data as of Quarter End: 2025-06-30T00:00:00
| Share Class | 1 Month | 3 Months | 6 Months | YTD | 1 Year | 3 Years Annualized | 5 Years Annualized | 10 Years Annualized | Since Inception Annualized |
| Class A | 2.76% | 7.61% | 5.57% | 5.57% | 12.68% | 8.27% | 6.78% | 3.94% | 5.42% |
| Class C | 2.62% | 7.46% | 5.16% | 5.16% | 11.89% | 7.48% | 6.02% | 3.26% | 3.46% |
| Class I | 2.99% | 2.52% | 9.28% | 9.28% | 14.01% | 2.02% | 7.20% | 2.89% | 5.37% |
| Class A w/Sales Load | -2.14% | 2.45% | 0.60% | 0.60% | 7.38% | 6.51% | 5.75% | 3.44% | 5.20% |
The maximum sales charge for Class “A” Shares is 4.75%. Class “C” Shares held for less than one year are subject to a 1% CDSC. Performance is historic and does not guarantee future results. Investment return and principal value will fluctuate with changing market conditions so that when redeemed, shares may be worth more or less than their original cost. Current performance may be lower or higher than the performance data quoted. To obtain the most recent month end performance information or the Fund’s prospectus please call 800-253-0412 or visit www.RationalMF.com.
Fund Expenses
Data as of: 2025-07-10T00:00:00
| Share Class | Class I | Class A | Class C | Class A w/ Sales Load |
| Prospectus Gross Expense Ratio (May 1, 2025) | 1.61% | 1.86% | 2.57% | 1.86% |
| Prospectus Net Expense Ratio (May 1, 2025) | 1.61% | 1.86% | 2.57% | 1.86% |
Past performance is not a guarantee of future results.
Investors should carefully consider the investment objectives, risks, charges and expenses of the Rational Funds. This and other important information about the Fund is contained in the prospectus, which can be obtained by calling (800) 253-0412 or at www.RationalMF.com. The prospectus should be read carefully before investing. The Rational Funds are distributed by Northern Lights Distributors, LLC member FINRA/SIPC. Rational Advisors, Inc. is not affiliated with Northern Lights Distributors, LLC.
Investing in the Fund carries certain risks. The value of the Fund may decrease in response to the activities and financial prospects of an individual security in the Fund’s portfolio. The performance of the Fund may be subject to substantial short-term changes. To the extent the Fund invests in the stocks of smaller-sized companies, the Fund may be subject to additional risks, including the risk that earnings and prospects of these companies are more volatile than larger companies. Smaller-sized companies may experience higher failure rates than larger companies and normally have lower trading volume than larger companies. These factors may affect the value of your investment. Investments in real estate investment trusts (REITS) involve special risks associated with an investment in real estate, such as limited liquidity and interest rate risks, and may be more volatile than other securities. There are no guarantees that dividend paying stocks will continue to pay dividends. In addition, dividend paying stocks may not experience the same capital appreciation potential as non-dividend. The performance of the Fund is based in part on the prices of one or more of the VIX Futures in which the Fund invests. Each of the equity securities held by the Fund and the VIX Futures are affected by a variety of factors and may change unpredictably, affecting the value of such equity securities and VIX Futures and, consequently, the value and the market price of the Fund’s shares.